|
Silvia and temperatures Background: I was quite interested to model the cooling, but following my Silvia I noticed the cycle to be different:
The blue curve is from Coffeegeek and digitized, the red is a fit based on temperatures, areas and convective heat transfer and the crosses mark the heating cycle connections made by Silvia (and its thermostat). The blue curve doesn't show other use but in the third cycle some water is run out of the boiler (at around 111 °C). I didn't manage to find any clarifications, how the temperatures were measured. But the start heating seemed to last longer, so I figured that maybe the 120 V machine has a smaller power. Measurement configurations:
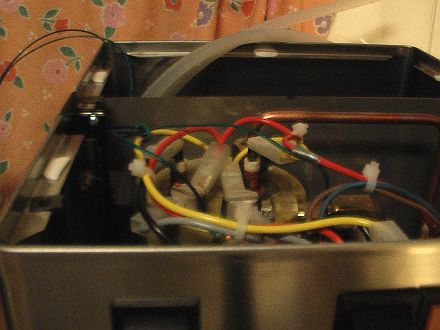
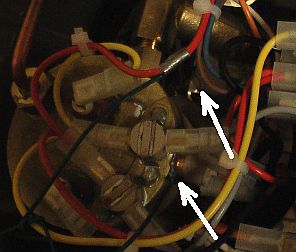
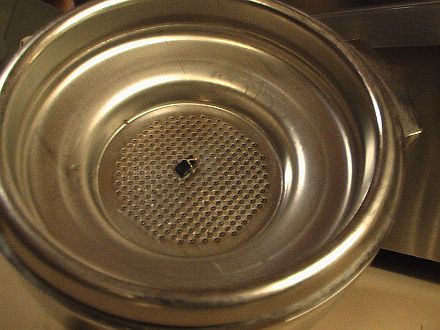
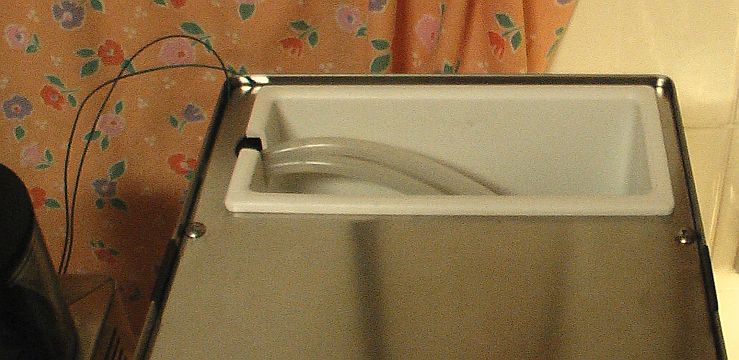
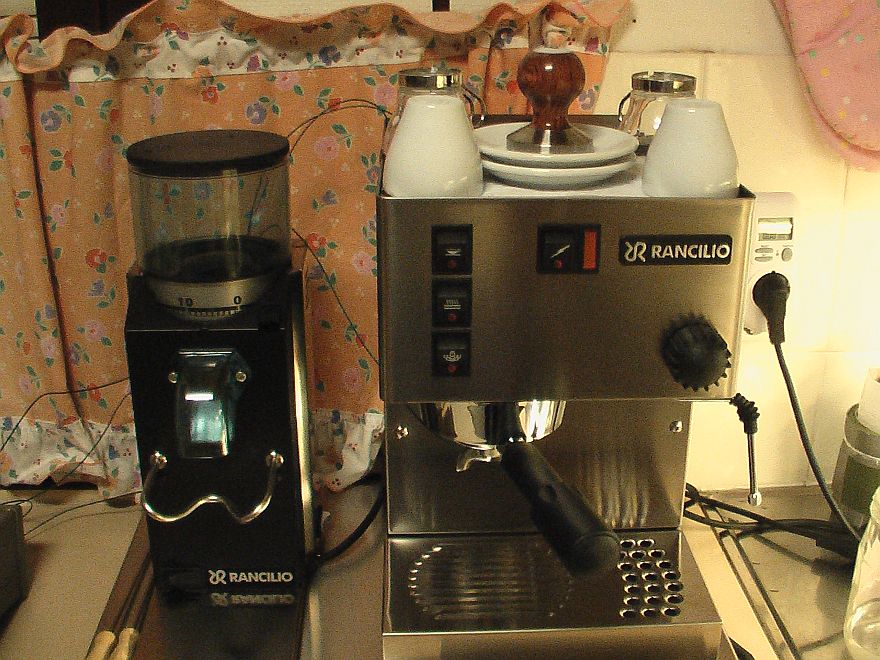
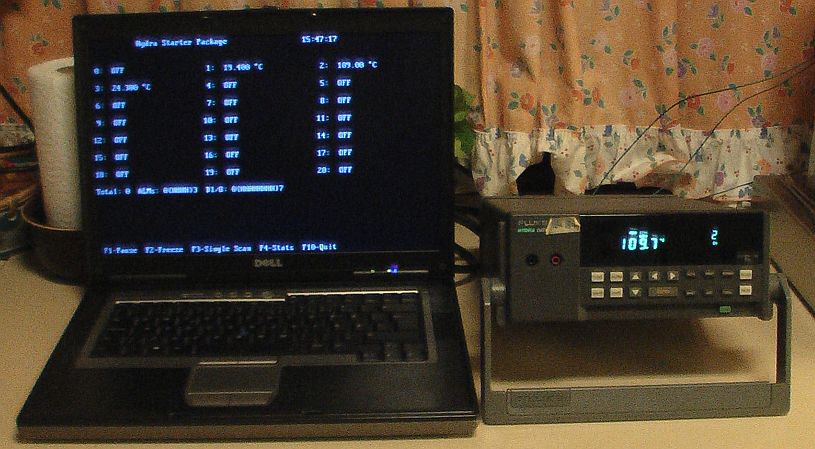
The first picture shows Silvia with the top cover removed and the two thermo elements as green wires. In the middle picture one can see the lower arrow showing the thermocouple measuring the surface of the boiler. The upper arrow show the thermo elements measuring the temperature of the surrounding space. The problem with the boiler temperature is that we are measuring the surface. Therefore, with rapid changes the brass wall of the boiler induces lag in the measurements. The isolation could be better, but as we reach above 120 degC, the measurements seem to give good results. Later I have moved the boiler surface measurement under the original thermocouple installation screw.. In the right picture one can see the single filter, in which the thermo element wires are threaded through the filter and encircled together on top of a small plastic piece. With this element we will discover the temperature of the water entering an empty filter and the temperature of the PF while on place. And using coffee, we will get the temperature inside the coffee cake during a brew. The pictures below show, how the elements come from below the top cover, in the middle one can see the element wire coming from the PF (click to a bigger view). The data logger Fluke Hydra 2620A and the data collection program on PC is shown in the right hand picture. The Starter program can log all the three elements within an interval of two to three seconds.
Measurement reports |