|
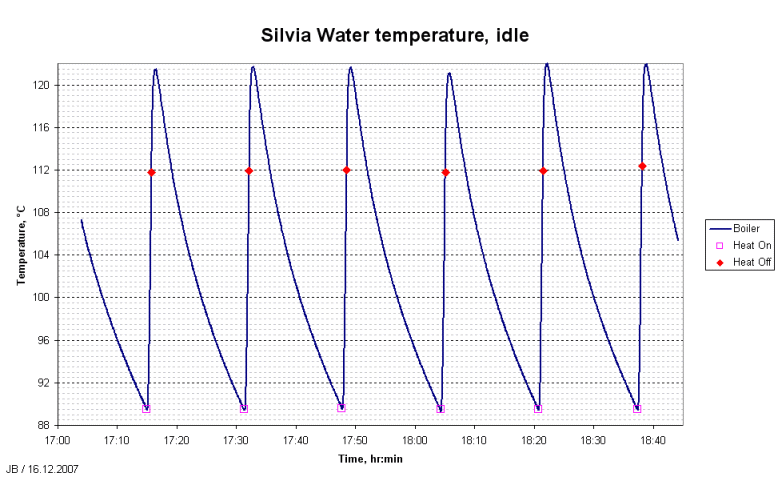
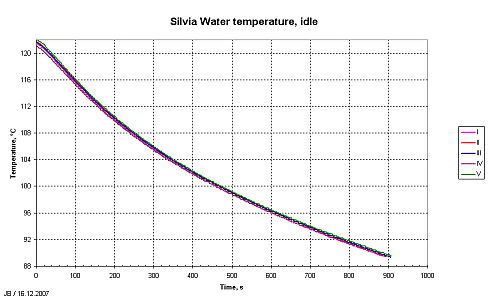
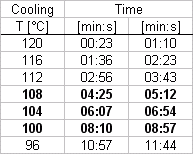
Silvia heats up and cools down This test was to measure the heating and cooling cycles of Silvia. The intention was to start with a cold Silvia, but there was a small mistake with the data logging and after the repair the test was continued already with a warm Silvia: The picture shows clearly, how Silvia repeats the same cycle. It was a small surprise that there was such a big lag with the maximum measurement and the heating disconnection. The red dots show the temperatures, where the element was shut down around 112 degC, but the surface temperature keeps increasing for 10 degrees and one minute. Which shows the lag of the measurement due to the thick wall of the boiler. At the disconnection point the temperature increases almost a degC per second. However, at the minimum point there is almost no lag at all. The changes in temperature are now so slow (one degC per 45..50 s). The minimum value and the conncetion of the element took place almost simultaneously. Lookin closer the several cooling curves, one can notice that they are almost identical and one could estimate the temperature change:
Simply put, 104 degC is achieved six minutes after the maximum pointa (or seven minutes from the shut off). This could be a good starting point to reversed temperature syrfing, but it does not take into account all the use that is needed for brewing coffee The lag has no essential effect to a PID control, as the controller is used to keep a constant temperature for the boiler before the brew. Normally, the changes in temperature usually are small at this stage.
Measurement reports |


