|
Silvian lämpötilat - Single Shot
Test I / 17.12.2007
This test was to measure the water
temperatures both from the boiler surface and the PF filter with a single shot,
around 7 g of coffee. The following picture has also one blank shot of 80
ml from 110 degC and two single shots from 104 degC (the shot is on the left
side of the text). The right hand corner shows the layout of Silvia with the
thermocouple locations.

The curve also shows how brewing
coffee also gives additional activities to the measurements. After the first
blank shot, Silvia is also used to wash the equipment. There was enough warm
water for both shots, and the heating started some time after the brew.
When we look more in detail what happens during the brew,
we get a better understanding of temperature profiles:

The upper picture is the 80 ml blank shot without coffee.
The brew starts at 110 degC boiler surface temperature and the PF just below 70
degC. The water release was 13 seconds (+/- 1 s) and the filter temperature
increases in five seconds to 91.3 degC and then decreases less than two
degrees by the end of the brew. Silvia's heating element starts five seconds
after the brew.
The single shots were started at 104
degC and the coffee temperatures before the brew were 67.7 and 72.1 degC. The
beginning of the picture shows, how fast the coffee temperature is increasing as
the PF is connected. The scale is deceiving as the increase is 7 - 10 degC per
minute.
In the filter, the temperature is
increasing again in five seconds to the maximum. This is the same speed as with
the blank. The maximum temperatures of the coffee are 89.7 degC and 89.4
degC and only 1.5 degrees lower than with the blank shot. As we note that the
water was six degrees higher, it seems that with the coffee cake we get more
efficient temperature increase.
As the temperature in the first shot
was 65 degC, Silvia cools quicker. However, the temperatures increase in the
filter to the maximum in the same time (which also is interesting) and they are
the same during the brew.
So, 104 degrees would give for a
single shot a brew temperature of 90 - 88 degC. Some comments has said it to be
ideal, although also some degrees higher temperatures have been recommend at
some sites.
Test II / 26.12.2007
The Christmas went without testing
as the theory needed some further study. Also, some simulation programs were
discussed. In
Ristretto also member K developed scientific theory to temperature
profiles.
On the Boxing Day a longer test run
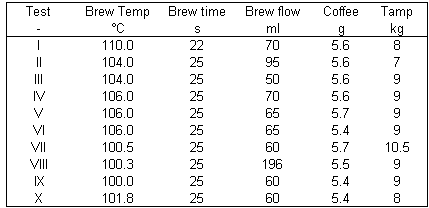
was prepared with ten single shots:

The brew flow is calculated by
adding to the cup also the water from the trip tray. And finally, the increase
in the PF mass after the brew is changed to water volume. As the water content
in the cake was only measured in test VIII forward, the average of 10 ml from
these tests was added to the previous tests and is included in the figures.
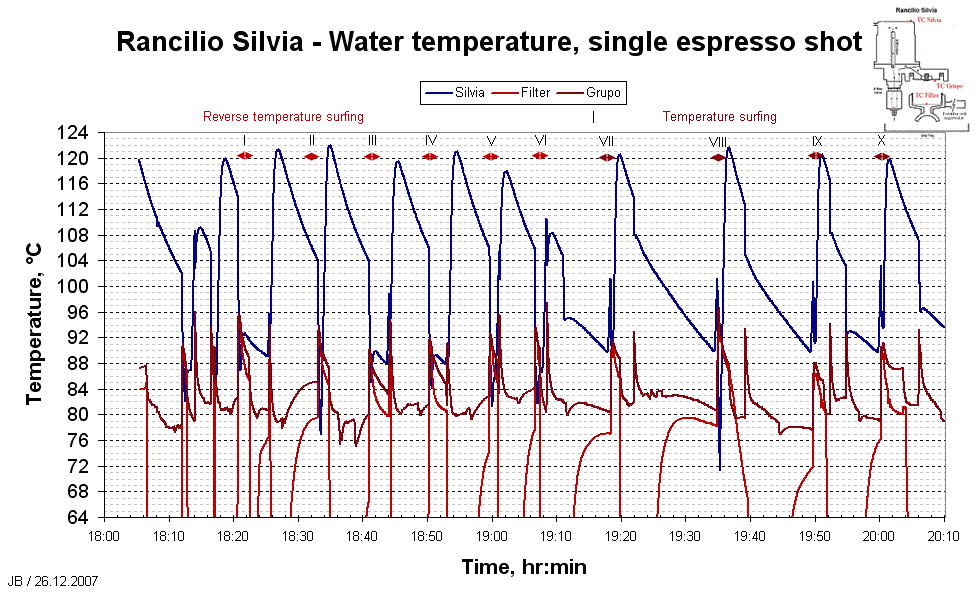
Tests I-VI were with the reversed
temperature surfing and VII-X with temperature surfing. For these tests an
additional thermocouple was installed under the screen. It was not quite easy as
although the thermocouple end could be twisted to be above the screw level, the
wire coming through the seal was sometimes hitting the cake. Probably tests II
and VII were suffering from this phenomenon as the water flow increased so much.
Also, without intention the first
reversed surfing started at 114 degC, 10 degrees higher than intended (noticed
only during processing the data). As shown here:

Tests I - IV (reversed temp
surfing):
104 degC reversed temp surfing got only one proper test as the first started 10
degrees too high and in the second the cake probably was distorted by the TC
wire. The third test gives similar results as above. The filter and group head
temperatures are close to each others.
The first 106 degC is also giving
similar responses. The lower red curve is from the filter and higher under the
screen (click picture to enlarge):

Tests V and VI:
Both with 106 degrees. The coffee temperature after reaching the maximum
level decrease with less than 1,5 degrees. The profiles look to be between 91
and 93 degrees. The filter starting temperature is almost 75 degrees, although
it is not visible in the picture.
Comparing all 106 degrees tests, the
profile are looking similar, but the maximum temperature increase in each test
with one degC. In test IV the filter temperature is 65 degC, in test V almost 75
degC and in test VI 77.7 degC (click picture to enlarge):

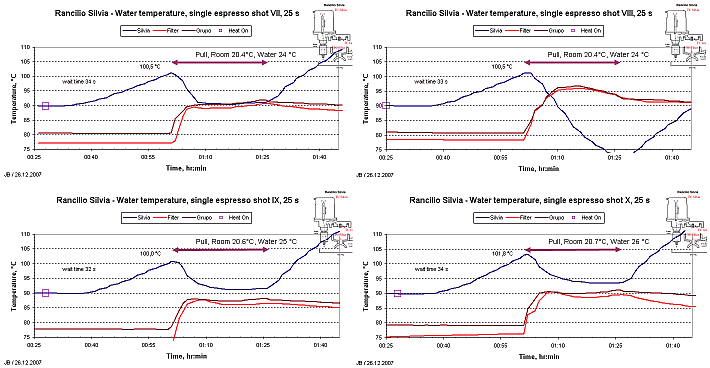
Tests VII - X:
The temp surfing was not as accurate as I would have wished. The temperature
increase speed and the data logging cycling made the timing slightly inaccurate.
The shown values have an uncertainty of one degC. In test VIII the cake was
spoiled by the TC wire as there were almost 2 dl of liquid and the temperatures
were very high in the PF. On the other hand, this picture show clearly that the
cold water flowing to the boiler lowers the surface temperature to below 75
degrees. The pictures show also the water temperature in the tank and the wait
time after the heating has stopped (click picture to enlarge):

Measurement reports
Heating and cooling testing
Blank shot testing
Single shot testing
Temperature measurements - main page |